Журнал "Гастроэнтерология" Том 51, №4, 2017
Розробка неінвазивної моделі для підвищення точності діагностики стадії фіброзу печінки при неалкогольній жировій хворобі печінки
Авторы: Степанов Ю.М., Недзвецька Н.В., Ягмур В.Б., Кленіна І.А., Ошмянська Н.Ю.
ДУ «Інститут гастроентерології НАМН України», м. Дніпро, Україна
Рубрики: Гастроэнтерология
Разделы: Клинические исследования
Резюме
Актуальність. Відмінність між м’яким (F1–2) і розвинутим фіброзом (F3–4), як і відсутність фіброзу у хворих на неалкогольну жирову хворобу печінки (НАЖХП), є важливим питанням для з’ясування прогнозу. Сироваткові маркери були запропоновані як альтернатива біопсії. Мета: розробити нову модель для визначення стадії фіброзу на основі більш ефективної комбінації серологічних маркерів та порівняння її з встановленими алгоритмами. Матеріали та методи. У дослідження включені 60 пацієнтів із НАЖХП, які проходили обстеження і лікування у відділенні захворювань печінки та підшлункової залози ДУ «Інститут гастроентерології НАМН України». Серед досліджених 26 (42,3 %) чоловіків та 34 (56,7 %) жінки, середній вік яких (37,1 ± 12,4) та (44,3 ± 7,3) року відповідно. Всім пацієнтам була проведена черезшкірна пункційна трепан-біопсія печінки з подальшим морфологічним дослідженням пунктату; виконано визначення вмісту гіалуронової кислоти, α2-макроглобуліну, аполіпопротеїну А1, фібронектину, гаптоглобіну в сироватці крові та був проведений розрахунок неінвазивних маркерів фіброзу печінки: AAR, APRI, FIB-4. Результати. Проведений ROC-аналіз показав, що найбільші показники площі під AUROC-кривою були для індексу FIB-4 для F2 — 0,72, F3 — 0,8, F4 — 0,82 при р < 0,05. Результати індексу APRI були вірогідно високими для помірного та вираженого фіброзу (F2 — 0,74, F3 — 0,82, р < 0,05). А показники AAR були вірогідними лише для цирозу печінки (площа під AUROC-кривою 0,89, р < 0,05). Установлено сильний прямий зв’язок між стадією фіброзу та рівнем гіалуронової кислоти, α2-макроглобуліну і фібронектину (r = 0,72, 0,93 та 0,71 відповідно при р < 0,05) та обернений зв’язок помірної сили між показниками аполіпопротеїну А1, гаптоглобіну (r = –0,61 і –0,35 при р < 0,05). Визначено прямий зв’язок помірної сили між ступенем активності запального процесу і показниками гіалуронової кислоти, α2-макроглобуліну і фібронектину (r = 0,54, 0,67 та 0,55 при р < 0,05) і обернений помірний зв’язок — аполіпопротеїну А1 та гаптоглобіну (r = –0,56 і –0,33 при р < 0,05). Висновки. Установлено, що найбільшу діагностичну цінність із неінвазивних маркерів фіброзу мають показники α2-макроглобуліну, аполіпопротеїну А1, гіалуронової кислоти та фібронектину, для яких площа під AUROC-кривою для мінімального фіброзу не була нижчою ніж 0,75, а для помірного, вираженого фіброзу та цирозу становила більше 0,9.
Актуальность. Отличие между мягким (F1–2) и развитым фиброзом (F3–4), как и отсутствие фиброза у больных неалкогольной жировой болезни печени (НАЖБП), является важным вопросом для выяснения прогноза. Сывороточные маркеры были предложены как альтернатива биопсии. Цель: разработать новую модель для определения стадии фиброза на основе более эффективной комбинации серологических маркеров и сравнения ее с установленными методами. Материалы и методы. В исследование включены 60 пациентов с НАЖБП, которые проходили обследование и лечение в отделении заболеваний печени и поджелудочной железы ГУ «Институт гастроэнтерологии НАМН Украины». Среди исследованных 26 (42,3 %) мужчин и 34 (56,7 %) женщины, средний возраст (37,1 ± 12,4) и (44,3 ± 7,3) года соответственно. Всем пациентам была проведена чрескожная пункционная трепан-биопсия печени с последующим морфологическим исследованием пунктата; выполнено определение содержания гиалуроновой кислоты, α2-макроглобулина, аполипопротеина А1, фибронектина, гаптоглобина в сыворотке крови и был проведен расчет неинвазивных маркеров фиброза печени: AAR, APRI, FIB-4. Результаты. Проведенный ROC-анализ показал, что наибольшие показатели площади под AUROC-кривой были для индекса FIB-4 для F2 — 0,72, F3 — 0,8, F4 — 0,82 при р < 0,05. Результаты индекса APRI были достоверно высокими для умеренного и выраженного фиброза (F2 — 0,74, F3 — 0,82, р < 0,05). А показатели AAR были достоверными только для цирроза печени (площадь под AUROC-кривой 0,89, р < 0,05). Установлены сильная прямая связь между стадией фиброза и уровнем гиалуроновой кислоты, α2-макроглобулина и фибронектина (r = 0,72, 0,93 и 0,71 при р < 0,05 соответственно) и обратная связь умеренной силы между показателями аполипопротеина А1, гаптоглобина (r = –0,61 и –0,35 при р < 0,05). Определена прямая связь умеренной силы между степенью активности воспалительного процесса и показателями гиалуроновой кислоты, α2-макроглобулина и фибронектина (r = 0,54, 0,67 и 0,55 при р < 0,05) и обратная умеренная связь — аполипопротеина А1 и гаптоглобина (r = –0,56 и –0,33 при р < 0,05). Выводы. Установлено, что наибольшую диагностическую ценность из неинвазивных маркеров фиброза имеют показатели α2-макроглобулина, аполипопротеина А1, гиалуроновой кислоты и фибронектина, для которых площадь под AUROC-кривой для минимального фиброза не была ниже 0,75, а для умеренного, выраженного фиброза и цирроза составляла больше 0,9.
Background. The differentiation of mild (F1-F2) and advanced fibrosis (F3-F4), as well as the exclusion of fibrosis in patients with nonalcoholic fatty liver disease (NAFLD), are extremely important for prediction of the disease course. Integrative analyses of serum markers have been proposed as promising alternatives to biopsy method. Our study was targeted to develop a new model for determining the stage of fibrosis based on a more efficient combination of serological markers and to compare it with well-established algorithms. Materials and methods. Sixty patients with biopsy-proven NAFLD, including 26 (43 %) men and 34 (57 %) women, with average age of 37.10 ± 12.4 and 44.30 ± 7.25 years, respectively, were recruited for the study. Particularly, advanced fibrosis was diagnosed in 8 patients, 28 had mild fibrosis and 24 didn’t have any fibrosis according to morphological study. The following fibrosis markers were calculated: aspartate aminotransferase and alanine aminotransferase ratio (AAR), aspartate aminotransferase to platelet ratio index (APRI), fibrosis index based on the 4 factor (FIB-4). Among many variables, hyaluronic acid, α2-macroglobulin, apolipoprotein A1, fibronectin, and haptoglobin were included in comprehensive study. Integrative model have been built up to determine the stage of fibrosis. The models were compared with the area under the receiver operating characteristic (AUROC) curves. Results. The ROC analysis showed that the FIB-4 demonstrated the largest AUROC, for the F2 — 0.72, F3 — 0.8, F4 — 0.82, respectively. Obtained results of the APRI were significantly higher for mild and advanced fibrosis (F2 — 0.74, F3 — 0.82). The AAR values were reliable only for liver cirrhosis (AUROC 0.89). A strong direct correlation was determined between the stage of fibrosis and the level of hyaluronic acid, α2-macroglobulin and fibronectin (r = 0.72, 0.93 and 0.71, p < 0.05, respectively). Whereas, we observed a moderate negative linear correlation between fibrosis stage and the indices of both apolipoprotein A1 and haptoglobin (r = –0.61; r = –0.35, respectively, p < 0.05). The positive correlation was determined between activity of the inflammatory process and the content of hyaluronic acid, α2-macroglobulin and fibronectin (r = 0.54, 0.67 and 0.55 at p < 0.05), while the reverse moderate relation observed for apolipoprotein A1 and hapthoglobin (r = –0.56 and –0.33, p < 0.05). Conclusions. The analysis of obtained results showed that α2-macroglobulin, apolipoprotein A1, hyaluronic acid, and fibronectin had the greatest diagnostic validity among non-invasive markers of fibrosis. Every of them get the AUROC level higher than 0.75 for minimal fibrosis and, moreover, for moderate, significant fibrosis and cirrhosis they had an area more than 0.9.
Ключевые слова
неалкогольна жирова хвороба печінки; фіброз печінки; біопсія печінки; неінвазивні методи діагностики
неалкогольная жировая болезнь печени; фиброз печени; биопсия печени; неинвазивные методы диагностики
nonalcoholic fatty liver disease; liver fibrosis; liver biopsy; non-invasive diagnostic methods
Introduction
Nonalcoholic fatty liver disease (NAFLD) is the most prevalent liver disease in the Western world and a common reason for clinical evaluation due to advance the liver function tests [1]. The histopathological features of NAFLD include a wide spectrum of changes, ranging from simple steatosis to steatohepatitis and cirrhosis with risk of developing hepatocellular carcinoma [1]. Moreover, NAFLD has been established as a risk factor for cardiovascular morbidity and it is closely associated with an increased risk of metabolic disease, including diabetes [2]. Several follow-up studies have de–monstrated increased mortality among patients with NAFLD. The main reason of the excess mortality belong to cardiovascular diseases, however, liver-related mortality is also greatly overrepresented [3, 4]. There is no mutual consent on the item of the differences between NAFLD patients that need the monitoring of early detection of future complications. However, hepatic fibrosis, particularly bridging fibrosis (stage 3) or cirrhosis (stage 4) can be considered as the histological parameters that predict future risk of complications [5, 6]. Moreover, identification of NAFLD in patients with cirrhosis is critically important because screening for hepatocellular carcinoma and gastroesophageal varices is mandatory in these patients. Liver biopsy is the clinical reference standard to assess the stage of fibrosis but this method has well documented problems as difficulties in samples obtaining, the interpretation variability as well as procedure related complications [7]. Liver biopsy is also expensive and it is characterized by low access especially for general practitioners who take care of the majority of NAFLD patients. The limitations of liver biopsy have led to development of a variety of serum markers to identify the patients who have risk for clinically significant hepatic fibrosis. The most common approach to assess the stage of fibrosis by serological analysis requires the routine biochemical and/or hematological tests. These indirect serum markers are based on the evaluation of common functional alterations in the liver, the changes that do not necessarily reflect extracellular matrix turnover and/or fibrogenic cell changes. A better understanding of the liver fibrosis pathophysiology has prompted investigators to use more refined markers to identify differences in fibrosis stages. These, so called direct serum markers, are intended to detect extracellular matrix turnover and/or fibrogenic cell changes. Markers may be used alone or combined with other direct or indirect markers to form the panels. Several algorithms including a combination of indirect markers have been developed in NAFLD patients NAFLD fibrosis score [10], GUCI [12], APRI [13], FIB-4 [14], Forms score. It is unclear whether the algorithms that were developed in NAFLD patients provide a better diagnostic accuracy. The Enhanced Liver Fibrosis (ELF) test is an example of a panel of direct markers, which highlight matrix turnover and consists of tissue inhibitor of matrix metalloproteinase 1 (TIMP 1), hyaluronic acid (HA), and aminoterminal peptide of pro-collagen III (P3NP) developed for a variety of liver disorders [18]. Although the ELF panel has been reported to have a good diagnostic accuracy in NAFLD patients, the addition of indirect markers augments its diagnostic performance [19]. Other researchers have reported that one direct marker (HA) in combination with several indirect markers provides the best estimation of area of fibrosis measured with quantitative image analysis [11].
The purpose of our study was to assess the accuracy of non-invasive fibrosis algorithms to distinguish advanced fibrosis in NAFLD. Algorithms originally developed in NAFLD patients as well as in other liver diseases were compared. Moreover, we aimed to develop a new non-invasive model for predicting advanced fibrosis in NAFLD and to compare its diagnostic accuracy with well established fibrosis algorithms.
Materials and methods
The study included patients with NAFLD who underwent examination and treatment in SI “Institute of Gastroenterology of National Academy of Medical Sciences of Ukraine”. The study involved 60 patients with NAFLD, including 26 (43 %) men and 34 (57 %) women, average age of the patients was (37.1 ± 12.4) and (44.30 ± 7.25) respectively. Every patient underwent physical examination, ultrasonography of the liver, laboratory investigation, and liver biopsy as part of the clinical work-up. Medical history was scrutinized as well as information regarding alcohol consumption. Blood pressure, waist circumference, body weight, and height were measured. Blood analysis for routine clinical biochemical analyses were performed at the local laboratories. These analyses included complete blood count and analysis of prothrombin time, alanine aminotransferase (ALT), aspartate aminotransferase (AST), alkaline phosphatase (ALP), gamma glutamyl transferase (GGT), bilirubin, fasting plasma glucose, total cholesterol, high-density lipoprotein, low-density lipoprotein, trigly–cerides. Moreover, serum samples were analyzed for levels of hyaluronic acid, α2-macroglobulin, apolipoprotein A1, fibronectin, and haptoglobin. Diagnosis of NAFLD was based on presence of hepatic steatosis at histopathological evaluation without evidence of alcohol consumption > 140 g/week, any other concomitant liver disease, or medication associated with fatty infiltration of the liver.
/49-1.jpg)
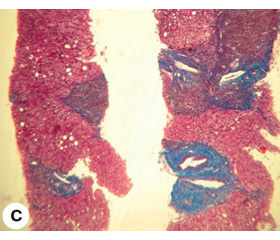
Liver biopsy and histopathological evaluation. A percutaneous liver biopsy was performed using a 16 gauge (1.6 mm) needle. The median (range) biopsy length was 20 mm (12 ± 32) mm. Biopsies were graded and staged according to the Brunt classification.
In the morphological study, the absence of fibrosis was found in 24 (40 %) patients, mild fibrosis (F1) occurred in 23 (38.3 %), moderate (F2) — 5 (8.3 %), severe (F3) — 4 (6.7 %), cirrhosis (F4) was detected in 4 (6.7 %) patients.
Non-invasive fibrosis algorithms. For each patient, the AST/ALT (AAR) ratio was determined. The APRI and FIB-4 indices were calculated as follows:
FIB-4 = (age (years) × AST (U/L))/(platelet count (G/L) × √ALT (U/L)).
APRI = (AST (U/L) × 100)/(AST (ULN) × platelet count (G/L)).
All relevant primary patient-level data are shown in table 2.
Statistical analysis. Statistical analyses were performed using SPSS (Statistica for Windows 10.0.) unless otherwise specified. The Shapiro-Wilk test was used to test for normal distribution. Median (range) was calculated for continuous variables, frequencies for categorical variables. Continuous variables were compared using the Student’s t test or the Mann — Whitney U test when appropriate. The χ2 test or Fischer’s exact test were used to compare categorical variables. A two-sided p-value < 0.05 was considered statistically significant if not specified otherwise. Receiver-operating characteristics (ROC) curves of the tested scores were constructed for each stage of fibrosis as well as the area under the ROC curve (AUROC) was calculated to assess the overall diagnostic accuracy of serum fibrosis algorithms and to identify optimal cutoffs. The sensitivity, specificity were calculated according to standard methods.
Results
60 patients with NAFLD were examined (26 (42.3 %) male and 34 (56.7 %) female), the average age of the subjects was (37.1 ± 12.4) and (44.3 ± 7.3) years in accordance. Anthropometric data of patients are presented in table 3.
The ROC analysis showed that FIB-4 index had the largest AUROC level for F 2 — 0.72, F3 — 0.8, F4 — 0.82, p < 0.05. We revealed APRI index was significantly higher for moderate and severe fibrosis (F2 — 0.74, F3 — 0.82, p < 0.05). And the AAR values were reliable only for liver cirrhosis (AUROC 0.89, p < 0.05).
The data of the ROC analysis, depending on the stage of fibrosis, as well as the reliability of the differences in the indicators between the groups are shown in table 4.
Correlation analysis showed a strong direct correlation between the stage of fibrosis and the level of hyaluronic acid, α2-macroglobulin and fibronectin (r = 0.72, 0.93 and 0.71 at p < 0.05 for Spearman correlation, respectively). The moderate negative linear correlation (r = –0.61 and –0.35, respectively, p < 0.05 for Spearman correlation) was found between the indices of apolipoprotein A1, hapthoglobin and the fibrosis stage. We determined modreate positive corellation between the degree of inflammatory process acrivity and the indices of hyaluronic acid, α2-macroglobulin and fibronectin (r = 0.54, 0.67 and 0.55, respectively, p < 0.05 for the Spearman correlation) and the inverse corellation for apolipoprotein A1 and haptoglobin (r = –0.56 and –0.33, respectively, p < 0.05 for the Spearman correlation).
To determine the diagnostic value of the investigated serum markers of fibrosis, an ROC analysis was performed, which resulted in a high sensitivity of the protein-bound oxyproline for fibroblastic stages from F2 to F4 and sufficient sensitivity for minimal fibrosis and cirrhosis of the liver (75 %). The largest AUROC level (0.699, CI 0.466–0.931; the optimal threshold — 167) was observed in a case of liver cirrhosis. But these results were not statistically significant (p > 0,05). On the contrary, the sensitivity and specificity of hyaluronic acid for F3 fibrosis were statistically significant (p < 0.005), and had the largest AUROC level (0.915, CI 0.837–0.992; the optimal threshold — 1.82).
The analysis of the results on the apolipoprotein A1 indices showed the largest AUROC level (0.997, CI 0.987–1.0; the optimal threshold — 1.13) was established for severe fibrosis (F3). The sensitivity of the method for all fibrosis stages was quite high (96.4–100 %), but the specificity for minimal fibrosis (F1) was low (38.9 %).
The determining of α2-macroglobulin was almost the ideal method in our study, for which AUROC level reached 1 for fibroblasts from F2 to F 4 with the optimum threshold — 2.17 for F2, 2.75 — for F3 and 2.96 — for F4.
Concerning haptoglobin, high level of specificity was determined in the case of F1 and F2 (94.4 and 100 % respectively) and had a rather low sensitivity level (33.0 and 40.4 % respectively) in patients with minimal fibrosis and was not statistically significant. The largest AUROC level (1; CI 1–1; the optimal threshold — 0.67) was defined for liver cirrhosis (F4).
The fibronectin indices with a high level of sensitivity and specificity at all stages of fibrosis were statistically signi–ficant. The largest AUROC level (curve) (0,996, CI 0.981–1.01; the optimal threshold — 0.411) was defined for liver cirrhosis (F4).
Consequently, based on the data of non-invasive fibrosis markers in patients with NAFLD, the highest diagnostic value was shown for α2-macroglobulin, apolipoprotein A1, hyaluronic acid and fibronectin, for which the AUROC le–vel for minimal fibrosis was higher than 0.75, and for moderate, severe fibrosis and cirrhosis was more than 0.9.
Based on presented results and correlation analysis data, as well as the sensitivity and specificity of non-invasive mar–kers, a model for diagnosing liver fibrosis was developed. The linear regression analysis was used for validation of the model.
The model of multiple linear regression for the indicator of the stage of liver fibrosis in patients with NAFLD had the following form:
Y = –2.0323 – 0.0011 × Х1 + 0.1173 × Х2 – 0.3090 × Х3 + 1.5905 × Х4 + 0.0283 × Х5 + 1.44 × Х6,
where Y — stage of fibrosis; X1 — the level of oxyproline protein-bound, X2 — the level of hyaluronic acid, X3 — the level of apolipoprotein A1, X4 — the level of α2-macroglobulin, Х5 — the level of haptoglobin, X6 — the level of fibronectin.
Discussion
According to the results of our study, APRI was the most sensitive of the calculated indices, but its sensitivity was sufficient only with developed fibrosis (F3–4). These data correspond with foreign studies.
Recent study of F.C. Kruger et al. [34], presented comparative analysis of the sensitivity and specificity of APRI, NFS and the ratio of ALT/AST. The analysis showed that for the diagnosis of severe fibrosis, APRI was more accurate than NFS and ALT/AST. Indicators of NFS in steatohepatitis were significantly lower in the group with severe fibrosis. Positive prognostic value for APRI was 54 %, while for NFS it was 34 %. Negative predictive value was 93 % for APRI and 94 % for NFS.
Study of Chinese researchers [35] included 131 patients, 41 (31.3 %), 20 (15.3 %) and 10 (7.6 %) of patients had moderate fibrosis, severe fibrosis and cirrhosis, respectively. The highest accuracy of APRI with severe fibrosis (AUROC 0.77) and liver cirrhosis (AUROC 0.86) was observed.
The results of our study of serum liver fibrosis markers showed the high correlation several of them with the stage of fibrosis and the degree of inflammation activity. Using a combination of these indicators can greatly improve the diagnosis of NAFLD. Thus, according to data of Indian researchers, [36] it was found the presence of strong positive correlation between the platelet count, gamma-gluta–myltranspeptidase and apolipoprotein A and the absence of liver fibrosis in patients with NAFLD (negative predictive value — 94.3 %). The results of study Sakugawa and coauthors, showed that level of hyaluronic acid can be used to reliably distinguish the initial (F0–2) and severe fibrosis (F3–4) (AUC = 0.97) [37]. Kaneda et al. [38] determined that hyaluronic acid was independent of prognostic factors of severe fibrosis (F3–4) (AUC = 0.97).
Conclusions
Consequently, the results of the study indicate a high diagnostic accuracy of the combination of serum markers for the diagnosis of both fibrosis and its stage in patients with NAFLD. A few intuition, accessibility and the possibility to control these markers will allow developing more effective treatment tactics and screening for the dynamics changes in this category of patients.
The characterized markers may be useful in primary care to «rule out» NAFLD patients with advanced fibrosis that should be referred for monitoring of liver-related complications. In secondary care they may be useful to «rule in» NAFLD patients with advanced fibrosis thereby reducing need for liver biopsies. However, our results lack external validation and need to be evaluated in future studies.
Conflicts of interests. Authors declare the absence of any conflicts of interests that might be construed to influence the results or interpretation of their manuscript.
Список литературы
1. Bellentani S., Saccoccio G., Masutti F. et al. EASL-EASD-EASO
Clinical Practice Guidelines for the managementof non-alcoholic fatty liver disease Prevalence of and risk factors for hepatic steatosis in Northern Italy // Ann. Intern. Med. — 2000. — 132. — 112-117.
2. Powell E.E., Jonsson J.R., Clouston A.D. Dangerous liaisons: the metabolic syndrome and nonalcoholic fatty liver disease // Ann. Intern. Med. — 2005. — 143. — 753-754.
3. Vernon G., Baranova A., Younossi Z.M. Systematic review: the epidemiology and natural history of non-alcoholic fatty liver di–sease and non-alcoholic steatohepatitis in adults // Aliment. Pharmacol. Ther. — 2011. — 34. — 274-285. — doi: 10.1111/j.1365-2036.2011.04724.x. [PMID: 21623852]
4. Turola E., Petta S, Vanni E. et al. Ovarian senescence increases liver fibrosis in humans and zebrafish with steatosis // Dis. Model. Mech. — 2015. — 8. — 1037-1046. — doi: 10.1242/dmm.019950. [PMID: 26183212]
5. Younossi Z.M., Koenig A.B., Abdelatif D., Fazel Y., Henry L., Wymer M. Global epidemiology of nonalcoholic fatty liver disease. Meta-analytic assessment of prevalence, incidence, and outcomes // Hepatology. — 2016. — 64. — 73-84. — doi: 10.1002/hep.28431. [PMID: 26707365]
6. Marchesini G., Mazzotti A. NAFLD incidence and remission: only a matter of weight gain and weight loss? // J. Hepatol. — 2015. — 62. — 15-17.
7. Bruno S., Maisonneuve P., Castellana P. et al. Incidence and risk factors for non-alcoholic steatohepatitis: prospective study of 5408 women enrolled in Italian tamoxifen chemoprevention trial // BMJ. — 2005. — 330. — 932. — doi: 10.1136/bmj.38391.663287.E0. [PMID: 15746106]
8. Lonardo A., Trande P. Are there any sex differences in fattyliver? A study of glucose metabolism and body fat distribution // J. Gastroenterol. Hepatol. — 2000. — 15. — 775-782. [PMID: 10937684]
9. Carter-Kent C., Zein N.N., Feldstein A.E. Cytokines in the pathogenesis of fatty liver and disease progression to steatohepatitis: implications for treatment // Am. J. Gastroenterol. — 2008. — 103. — 1036-1042.
10. Marchesini G., Brizi M., Morselli-Labate A.M. et al. Association of nonalcoholic fatty liver disease with insulin resistance // Am. J. Med. — 1999. — 107. — 450-455.
11. Younossi Z.M. Review article: current management of non-alcoholic fatty liver disease and non-alcoholic steatohepatitis // Aliment. Pharmacol. Ther. — 2008. — 28. — 2-12.
12. Tarantino G. Should nonalcoholic fatty liver disease be regarded as a hepatic illness only? // World J. Gastroenterol. — 2007. — 13. — 4669-4672.
13. Sanyal A.J. AGA technical review on nonalcoholic fatty liver disease // Gastroenterology. — 2002. — 123. — 1705-1725.
14. Edmison J., McCullough A.J. Pathogenesis of non-alcoholic steatohepatitis: human data // Clin. Liver Dis. — 2007. — 11. — 75-104.
15. Tilg H., Diehl A.M. Cytokines in alcoholic and nonalcoholic steatohepatitis // N. Engl. J. Med. — 2000. — 343. — 1467-1476.
16. Abenavoli L., Peta V. Role of adipokines and cytokines in non-alcoholic fatty liver disease // Rev. Recent Clin. Trials. — 2014. — 9(3). — 134-140.
17. Sanyal A.J. AGA technical review on nonalcoholic fatty liver disease // Gastroenterology. — 2002. — 123. — 1705-1725.
18. Ryan C.K., Johnson L.A., Germin B.I., Marcos A. One hundred consecutive hepatic biopsies in the workup of living donors for right lobe liver transplantation // Liver Transpl. — 2002. — 8. — 1114-1122.
19. Rifai K., Cornberg J., Mederacke I. et al. Clinical feasibility of liver elastography by acoustic radiation force impulse imaging (ARFI) // Dig. Liver Dis. — 2011. — 43. — 491-497.
20. Lewis J.R., Mohanty S.R. Nonalcoholic fatty liver disease: a review and update // Dig. Dis. Sci. — 2010. — 55. — 560-578.
21. Bril F., Barb D., Portillo-Sanchez P. et al. Metabolic and histological implications of intrahepatic triglyceride content in nonalcoholic fatty liver disease // Hepatology. — 2017 Apr. — 65(4). — 1132-1144. — doi: 10.1002/hep.28985.
22. Di Martino M., Pacifico L., Bezzi M. et al. Comparison of magnetic resonance spectroscopy, proton density fat fraction and histological analysis in the quantification of liver steatosis in children and adolescents // World J. Gastroenterol. — 2016, Oct 21. — 22(39). — 8812-8819.
23. Shukla A., Kapileswar S., Gogtay N. et al. Simple biochemical parameters and a novel score correlate with absence of fibrosis in patients with nonalcoholic fatty liver disease // Indian J. Gastroenterol. — 2015 Jul. — 34(4). — 281-285. — doi: 0.1007/s12664-015-0580-5.
24. Rossi E., Adams L.A., Ching H.L., Bulsara M., MacQuillan G.C., Jeffrey G.P. High biological variation of serum hyaluronic acid and Hepascore, a biochemical marker model for the prediction of liver fibrosis // Clin. Chem. Lab. Med. — 2013 May. — 51(5). — 1107-14. — doi: 10.1515/cclm-2012-0584.
25. EASL–EASD–EASO Clinical Practice Guidelines for the management of non-alcoholic fatty liver disease // J. Hepatol. — 2016. — doi: 10.1016/j.jhep. 2015.11.004.
26. Oh M.K., Winn J., Poordad F. Review article: diagnosis and treatment of non-alcoholic fatty liver disease // Aliment. Pharmacol. Ther. — 2008. — 28. — 503-522.
27. Adams L.A., Angulo P. Role of liver biopsy and serum markers of liver fibrosis in non-alcoholic fatty liver disease // Clin. Liver Dis. — 2007. — 11. — 25-35.
28. Fracanzani A.L., Valenti L., Bugianesi E. et al. Risk of severe liver disease in nonalcoholic fatty liver disease with normal aminotransferase levels: a role for insulin resistance and diabetes // Hepatology. — 2008. — 48. — 792-798.
29. Chalasani N., Younossi Z., Lavine J.E. et al. The diagnosis and management of non-alcoholic fatty liver disease: Practice guideline by the American association for the study of liver diseases, American college of gastroenterology, and the American gastroenterological association // Am. J. Gastroenterol. — 2012. — 107. — 811-826. — doi: 10.1038/ajg.2012.128.
30. Tiniakos D.G., Vos M.B., Brunt E.M. Nonalcoholic fatty liver disease: pathology and pathogenesis // Ann. Rev. Pathol. — 2010. — 5. — 145-171.
31. Brunt E.M. Pathology of nonalcoholic fatty liver disease // Nat. Rev. Gastroenterol. Hepatol. — 2010. — 7. — 195-203.
32. Armstrong M.J., Houlihan D.D., Bentham L., Shaw J.C., Cramb R., Olliff S. et al. Presence and severity of non-alcoholic fatty liver disease in a large prospective primary care cohort // J. Hepatol. — 2012. — 56. — 234-240. — doi: 10.1016/j.jhep.2011.03.020. [PMID: 21703178]
33. EASL-EASD-EASO Clinical Practice Guidelines for the management of non-alcoholic fatty liver disease // J. Hepatol. — 2016. — 64. — 1388-1402. — doi: 10.1016/j.jhep.2015.11.004. [PMID: 27062661]
34. Boursier J., Vergniol J., Guillet A., Hiriart J.B., Lannes A., Le Bail B. et al. Diagnostic accuracy and prognostic significance of blood fibrosis tests and liver stiffness measurement by FibroScan in non-alcoholic fatty liver disease // J. Hepatol. — 2016. — 65. — 570-578. — doi: 10.1016/j.jhep.2016.04.023. [PMID: 27151181]
35. Dyson J.K., Anstee Q.M., McPherson S. Nonalcoholic fatty liver disease: A practical approach to diagnosis and staging // Frontline Gastroneterol. — 2014. — 5. — 211-218.
36. Demir M., Lang S., Schlattjan M., Drebber U., Wedemeyer I., Nierhoff D. et al. NIKEI: a new inexpensive and non-invasive scoring system to exclude advanced fibrosis in patients with NAFLD // PLOS Оne. — 2013. — 8. — 58360. — doi: 0.1371/journal.pone.0058360. [PMID: 23555578]
37. Angulo P., Kleiner D.E., Dam-Larsen S., Adams L.A., BjoÈrnsson E.S., Charatcharoenwitthaya P. et al. Liver fibrosis, but no other histologic features, is associated with long-term outcomes of patients with nonalcoholic fatty liver disease // Gastroenterology. — 2015. — 149. — 389-397. — doi: 10.1053/j.gastro.2015.04.043. [PMID: 25935633]
38. Ekstedt M., HagstroÈm H., Nasr P., Fredrikson M., Stål P., Kechagias S. et al. Fibrosis stage is the strongest predictor for disease-specific mortality in NAFLD after up to 33 years of follow-up // Hepatology. — 2015. — 61. — 1547-1554. — doi: 10.1002/hep.27368. [PMID: 25125077]

/49-1.jpg)
/50-1.jpg)
/51-1.jpg)