Introduction
Determination of hip instability is the main goal of pediatric orthopedists in patients with cerebral palsy (CP). Early detection of hip displacement is the basis of many screening systems due to the high frequency of spastic hip dislocation in this category of patients. Bone and joint pathology in combination with muscle imbalance leads to decentralization of femoral head and progression of hip instability.
The described features encourage researchers to look for diagnostic indicators that can detect hip instability and prevent hip displacement in patients with CP, to switch from conservative to surgical treatment in time.
The main current parameter for determining the hip instability in patients with CP is the migration percentage (MP) [1]. A large amount of researches have investigated it, as well as screening systems have been developed. In 2016, a team of Swiss authors proposed a new parameter for the diagnosis of unstable or stable hip with borderline dysplasia named the Femoro-Epiphyseal Acetabular Roof (FEAR) index. It demonstrated good reliability in detecting instability in patients with developmental dysplasia of the hip (DDH) [2]. Additional factors that contribute to instability include femoral torsion (FT), acetabular roof inclination, and neck-shaft angle (NSA) [2]. These parameters are often pathologically altered in patients with CP, the early diagnosis of which is extremely important.
This prompted us to study the FEAR index in more detail, to find dependencies with the parameters of the hip joint (HJ) and the factors that may affect it. We were inte-rested whether it could replace the MP to diagnose hip instability in patients with CP.
The purpose of the study was to establish the diagnostic value of the FEAR index to determine the hip instability in patients with cerebral palsy.
Materials and methods
Our research is based on a study of clinical data of 39 patients (70 joints) treated for the hip joint pathology in cerebral palsy at the ITO NAMS from 2018 to 2021. Patients’ gender was not taken into account, as previous stu-dies did not report significant differences between the sexes [3]. None of the patients had a history of bone surgery. We investigated various factors that may affect the FEAR index: age, Gross Motor Function Classification System (GMFCS) [4], level of lesions (paraparesis, tetraparesis, hemiparesis), ambulatory status (ambulating, non-ambulating), adductor myotomy in the past medical history, DDH. We also looked for dependencies of the pathology of the proximal femur (NSA and FT) and acetabulum (aceta-bular angle (AA) and Sharp angle (SA)) on the FEAR index. Additionally, Wiberg angle (WA) was determined. The age of patients ranged from 5 to 30 years: 5–6 years (n = 7), 7–9 years (n = 10), 10–12 years (n = 8), 13–16 years (n = 13), 30 years (n = 1). We did not consider children under 5 years of age due to a specific form of epiphyseal cartilage of the femoral head, which does not allow us to correctly measure the FEAR index. Nine patients had GMFCS level II, 11 — level III, 11 — level IV. The sample in this study consisted mainly of patients with spastic tetraparesis (n = 26), spastic paraparesis (n = 5) and hemiparesis (n = 8). Each hip joint was evaluated separately; in people with hemiparesis, only the affected side was examined. Twenty-nine of our patients were ambulating, and 10 — non-ambulating at the moment of the examination, but we considered them promising in terms of verticalization, or if gait function was lost due to spastic hip dislocation. Adductor myotomy was performed in 8 people. In 10 cases, radiographs of the HJ at the age of 3 months were preserved: 6 patients with DDH, and 4 individuals born with healthy hips. Data on whether DDH was treated before the age of 1 year were not taken into account due to their absence. In order to avoid exposure of healthy children, the norms were taken from Ya.B. Kutsenok (Table 1) [5].
/52.jpg)
The migration percentage of up to 33 % was regarded as a stable joint, hip joint was unstable with MP more than 33 % [1].
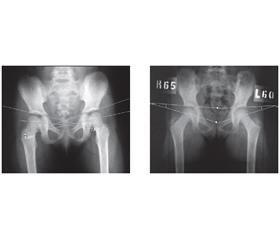
All patients underwent clinical evaluation of the FT by Ruwe [6], anterior posterior radiography of the HJ in standard positioning (SP) and positioning according to our own method (PATOOM) (Fig. 1a, b) in which the true parameters were received [7]. The absence of significant differences in the acetabular parameters (p > 0.05) between the two positionings, as well as the high accuracy of the FT and NSA measurement using our original method compared to intraoperative data, were described by us in previous works [8].
The FEAR index was measured in both positionings to investigate the effect of FT on it, as well as to reveal how the orientation of the epiphyseal plate on the acetabulum changes after internal rotation of the femur. The angle of the epiphyseal plate indicates the balance of forces in the proximal femur [9].
Measurement of the FEAR index (Fig. 2): the physeal scar of the femoral head normally has a slightly irregular but consistent shape. The central third is radiologically a straight line, which then bends distally medially and distally laterally from the femoral neck. We draw lines through the most lateral and medial points of the straight section of the the physeal scar. The second line of the angle is determined by the most medial and lateral points of the sclerosis of the sourcil. The FEAR index is positive when the angle is open laterally, with the vertex directed medially; it was negative with the medially opened corner, and the apex directed laterally [2].
Statistical data processing was performed with Statistica 7.0, MedCalc Statical Software v.11.5.0.0 programs using the χ² criterion, multiple logistic regression (calculating the odds ratio, 95% confidence interval) and ROC analysis, and by determining the area under the curve (AUC).
Depending on the type and nature of the data distribution, the corresponding statistical criterion was chosen to assess the reliability of the influence of the factor. For parameters that had a normal distribution, parametric me-thods of statistical evaluation were used. Differences were considered significant at P < 0.05.
The results of the analysis are presented in the form of distributions of clinical parameters (%), arithmetic mean and standard deviation (M ± SD). Comparisons between groups were performed using the Chi-square test and one-way analysis of variance for the respective data types. Spearman’s correlation coefficient was used to estimate the relationship between radiographic parameters and other factors. To study the prognostic factors, multiple logistic regression was performed using step-by-step exclusion of uninformative indicators to leave only significant independent variables in the final model. Critical value, sensitivity and specificity of the indicator were assessed using ROC analysis.
Results
The subjects of this study were the parameters of the HJ in patients with CP. We analyzed the relationships of the FEAR index with the factors, as well as the parameters of the HJ (NSA, FT, AA, SA) to demonstrate how they affect them. Most patients had stable hips and were able to ambulate, 23 hips had a MP > 33 %.
Using Spearman’s method, no significant correlations were found in the groups of patients by age and the FEAR index in SP (R = –0.18, p = 0.136). In PATOOM, a reliable, strong, inverse correlation was revealed (R = –0.38, p = 0.001).
A reliable, strong, direct correlation (R = 0.41, p = 0.001) was found between GMFCS level (II, III, IV) and FEAR index in SP. In PATOOM, a reliable, strong, direct correlation was revealed (R = 0.60, p = 0.000).
No significant correlations were found (R = 0.16, p = 0.175) between groups of patients (tetraparesis, paraparesis, hemiparesis) and the FEAR index in SP. In
PATOOM, a reliable, medium-strength, direct correlation (R = 0.33, p = 0.005) was revealed.
When searching for the relationship by ambulation status (ambulating, non-ambulating) and FEAR index in SP, a reliable, medium-strength, direct correlation was found (R = 0.35, p = 0.002). A reliable, strong, direct correlation (R = 0.51, p = 0.000) was revealed in PATOOM.
A reliable, weak, inverse correlation was found (R = –0.28, p = 0.018) between groups of patients with and without adductor myotomy in the past medical history and the FEAR index in SP. In PATOOM, a reliable, weak, inverse correlation (R = –0.30, p = 0.011) was revealed.
No significant correlations were found (R = 0.22, p = 0.380) between patients with confirmed data on DDH (DDH, healthy joints at birth) and the FEAR index in SP. In PATOOM, a reliable, medium, direct correlation (R = 0.69, p = 0.002) was revealed.
A reliable, strong, direct correlation (R = 0.39, p = 0.001) was found when looking for an association between NSA and FEAR index in SP. In PATOOM, a reliable, strong, direct correlation (R = 0.47, p = 0.000) was revealed.
A reliable, moderate, direct correlation (R = 0.32, p = 0.006) was found between the FT and the FEAR index in SP. In PATOOM, no significant correlations were revealed (R = 0.21, p = 0.077).
A reliable, strong, direct correlation (R = 0.51, p = 0.000) was found between the AA and the FEAR index in patients’ groups in SP. In PATOOM, a reliable, strong, direct correlation (R = 0.67, p = 0.000) was revealed.
A reliable, strong, direct correlation (R = 0.50, p = 0.000) was found between the SA and the FEAR index in SP. In PATOOM, a reliable, strong, direct correlation (R = 0.56, p = 0.000) was revealed.
A reliable, strong, inverse correlation (R = –0.53, p = 0.000) was found between the WA and the FEAR index in SP. A reliable, strong, inverse correlation (R = –0.73, p = 0.000) was revealed in PATOOM.
A reliable, strong, direct correlation (R = 0.53, p = 0.000) was found when searching for the relationship between the MP and the FEAR index in in SP. In PATOOM, a reliable, strong, direct correlation (R = 0.67 p = 0.000) was revealed.
To determine which parameter more accurately determines the hip instability in patients with CP, we created mathematical models based on the parameters defined in both positionings: for the migration percentage, which is common, and the new FEAR index.
Mathematical models for detecting instability in the joint
In the standard positioning
Y — the probability of the FEAR index (Fig. 4).
Y = 0.133 × AA – 0.045 × age + 0.067 × FT + 0.047 × NSA – 11.92.
Chi-square = 27.96, P < 0.001
The accuracy of the model is 71.4 %. Belonging to group 0 (negative FEAR index) is determined by the model with an accuracy of 70 %, and belonging to group 1 (positive FEAR index) — with an accuracy of 72.5 %.
AUC = 0.833 (0.725–0.912), chi-square = 27.96,
P < 0.001. The model has a good predictive power.
AUC = 0.833, P < 0.001 compared to the diagonal (AUC = 0.5), which indicates a good estimate of the probability of having a positive FEAR index.
Y — the probability of the migration percentage (Fig. 5).
Y = 0.419 × AA – 0.13 × age + 0.041 × FT + 0.059 × × NSA – 18.9.
Chi-square = 59.6, P < 0.001.
The accuracy of the model is 92.9 %. Belonging to group 0 (migration percentage < 33 %) is determined by the model with an accuracy of 95.7 %, and belonging to group 1 (migration percentage > 33 %) — with an accuracy of 87 %. AUC = 0.970 (0.899–0.996), chi-square = 59.6, P < 0.001. The model has a very good predictive power.
AUC = 0.970, P < 0.001 compared to the diagonal (AUC = 0.5), which indicates a good estimate of the pro-bability of having a migration percentage > 33 %.
In positioning according to our method
Y — the probability of the FEAR index (Fig. 6).
Y = 0.443 × AA – 0.561 × age + 0.054 × FT + 0.121 × NSA – 24.94.
Chi-square = 61.9, P < 0.001.
The accuracy of the model is 88.6 %. Belonging to group 0 (negative FEAR index) is determined by the model with an accuracy of 93.3 %, and belonging to group 1 (positive FEAR index) — with an accuracy of 80 %. AUC = 0.972 (0.901– 0.997), chi-square = 61.9, P < 0.001. The model has a good predictive power.
AUC = 0.972, P < 0.001 compared to the diagonal (AUC = 0.5), which indicates a good estimate of the pro-bability of having a positive FEAR index.
Y — the probability of the migration percentage (Fig. 7).
Y = 0.269 × AA – 0.035 × age + 0.14 × FT + 0.0015 × NSA – 14.5.
Chi-square 39.6, P < 0.001.
The accuracy of the model is 87.1 %. Belonging to group 0 (migration percentage < 33 %) is determined by the model with an accuracy of 94.3 %, and belonging to group 1 (migration percentage > 33 %) — with an accuracy of 64.7 %. AUC = 0.938 (0.853–0.982), chi-square = 39.6, P < 0.001. The model has a very good predictive power.
AUC = 0.938, P < 0.001 compared to the diagonal (AUC = 0.5), which indicates a good estimate of the probability of having a migration percentage > 33 %.
Discussion
Our research is based on the study of the HJ radiographs of patients who sought specialized care in the ITO NAMS, we did not conduct a total screening of all individuals with CP. Some patients did not ambulate on their own, but we considered them promising in terms of verticalization. In the older age groups, patients who could ambulate independently dominated. Severe forms of CP were less common in older people, which may lead to debate about the validity of some results. FT was normal in 3 joints. In all groups, we presented the HJ regardless of distibution, criteria and factors.
With age, in the process of growth and development, the parameters of the HJ change in the norm — there is a decrease in NSA, FT, AA, SA. In patients with CP, the influence on the HJ formation has a large number of factors that can not always be taken into account when predicting its development. Therefore, some of these indicators do not decrease with age, and sometimes even increase. The lack of correlations between age and the FEAR index in SP and strong, inverse correlations in PATOOM may indicate the importance of the torsional component in the formation of the HJ, as PATOOM is performed with internal rotation of the femur. The angle of femoral internal rotation corresponds to the angle of FT, which is often increased in patients with CP. With increasing age, the frequency of detecting a positive FEAR index decreased in PATOOM. As the number of patients examined increases, the data will be updated.
Strong, direct correlations in both positionings between the GMFCS level (II, III, IV) and the FEAR index indicate an increase in the frequency of detecting a positive FEAR index with increasing levels of major motor disorders. This confirms the trends in the world literature that in severe forms of CP, the risk of hip displacement is much higher.
The absence of correlations between the level of lesion (tetraparesis, paraparesis, hemiparesis) and the FEAR index in SP and the appearance of reliable, medium-strong, direct correlations in PATOOM confirm the importance of the torsional component in the formation of hip instability. According to the literature, impaired development of the HJ in hemiparesis is uncommon. The most severe form of CP in terms of the level of lesions is tetraparesis, the largest group of patients we study. All our patients with paraparesis and hemiparesis were able to move independently, without aid.
A reliable, medium-strength, direct correlation in SP between ambulatory status (ambulating, non-ambulating) and the FEAR index and a strong, direct correlation in
PATOOM indicates the importance of gait function for proper formation of the HJ, and strengthening correlations in PATOOM is another confirmation of the importance of FT in the development of the HJ and prevention of instability.
Significant, weak, inverse correlations in both positionings between adductor myotomy (patients with and without adductor myotomy in the past medical history) and the FEAR index may indicate a slight impact of this intervention on the formation of the HJ and the emergence of instability. This result may be controversial, but as the number of joints examined increases, the data will be refined. The purpose of myotomy is to weaken the abductor muscles and redistribute the forces of the antagonist muscles. Obviously, after such an intervention, there is no balance in the HJ, but a partial change in the force vector. Indications for adductor myotomy are exclusively clinical, bone pathology of the hip joint is not taken into account. Determining the FEAR index before adductor myotomy and after surgery could be of great value.
The lack of correlations in SP between DDH (DDH, healthy joints at birth) and the FEAR index and the appea-rance of reliable, medium, direct correlations in PATOOM confirms the influence of FT on the formation of HJ and instability in it, as increased FT is one of the signs of DDH. In addition, when analyzing the indicators of the acetabulum, DDH could be detected in a much larger proportion of our patients [13].
Significant, strong, direct correlations between NSA and the FEAR index were found in both positionings, which may indicate the effect of increased NSA on hip formation and instability.
There was also a significant, medium-strength, direct correlation between the FT and the FEAR index in SP and no significant correlations were found in PATOOM because in the latter we perform internal rotation of the femur by the FT angle, which eliminates its value. The FEAR index was positive in 40 joints. In 14 joints, it changed from positive in SP to negative in PATOOM (Fig. 3a, b), which, in our opinion, makes it possible to recommend the correction of FT surgically (derotation osteotomy) in order to stabilize the joint and ensure further proper development. If the FEAR index has not changed to negative, one should consider pelvic osteotomy with derotation osteotomy, taking into account the parameters of the HJ.
Significant, strong, direct correlations between the AA and the FEAR index in both positionings were also found. Increasing the indicators of the acetabulum in the frontal plane (AA and SA) increases the frequency of detecting a positive FEAR index, i.e. instability of the HJ and disorders of its development. Of the 26 joints with positive FEAR index in both positionings, AA was less than 20° only in 2 joints, i.e. signs of instability were also associated with the acetabular component.
A reliable, strong, inverse correlation between the WA and the FEAR index and a reliable, strong, direct correlation between the MP and the FEAR index were found in both positionings. These three indicators characterize the relationship between the proximal femur and the acetabulum. Unfortunately, WA does not show any signs of clinical stability of the thigh [2], so we did not create a mathematical model with it. The MP and the FEAR index are designed to detect hip displacement and correlate well with each other. Only in 3 joints with positive FEAR index, the MP was less than 33 %.
All our mathematical models have shown good predictive power for determining hip instability (migration percentage > 33 %). The most accurate (92.9 %) was the mathematical model (probability of migration percentage > 33 %) in the standard positioning. For each indicator included in the model, a ROC analysis was performed to determine the prognostic value and critical level. The critical levels of indicators at which instability is detected are as follows: AA > 19.44°, FT > 50°, NSA > 153.1°, age ≤ 12 years (Fig. 5). It should be noted that for this model, the projection NSA was taken. We did not accidentally choose these parameters of the HJ, we corrected them during surgery. AA had the highest prognostic value for determining hip instability (migration percentage > 33 %), NSA and FT also had a high prognostic value. Age has little effect on the accuracy of the model, but can not be ignored in children, as the parameters of the HJ change with age and with normal development of the HJ. Seventy joints were used to develop the model: 23 (32.86 %) were unstable (migration percentage > 33 %), 47 (67.14 %) were stable (migration percentage < 33 %). Slightly lower accuracy of detection of the migration percentage > 33 % in the mathematical model may indicate difficulties in identifying the edge of the acetabulum in hip instability in patients with CP [1]. In an unstable HJ, the pressure of the femoral head on the edge of the acetabulum causes the formation of a gothic arch, which creates additional difficulties in measuring the parameters of the HJ [14].
In PATOOM, mathematical models were less accurate than in SP, although they also had good predictive power. During the internal rotation of the femur, the femoral head was often inserted into the unstable HJ, and accordingly there was an improvement of the relationship between the proximal femur and the acetabulum, which affected its accuracy. When analyzing mathematical models in PATOOM with true NSA, its critical level, in which instability is detected, was 135.88° for the mathematical model with pro-bability of positive FEAR index, and 132.46° for the mathematical model with probability of migration percentage > 33 % (Fig. 7c). This value of NSA is the norm for youn-ger age groups; in older age groups, a slight deviation from the norm was found (NSA for children aged 13–16 years is 128.61 ± 1.98°) [5]. When measuring NSA of 132.46°, there was virtually no migration percentage > 33 %, i.e. unstable HJ, although with increasing critical level of NSA, stable and unstable HJ were found (Fig. 5c). The FEAR index in PATOOM had a slightly greater prognostic power than MP.
The critical level of FT at which the instability is detected was > 50° in both mathematical models in SP (Fig. 4b, 5b). In PATOOM, the critical level of FT was > 55° (Fig. 6b, 7b).
The critical level of AA at which the instability is detected was > 14.84° for the mathematical model with the probability of detecting positive FEAR index in the standard positioning — the lowest average value (Fig. 4a). For the mathematical model with the probability of detecting positive FEAR index in PATOOM, the critical level of AA was > 21.42° (Fig. 6a). For the mathematical model with the probability of the migration percentage > 33 % in PATOOM, the critical level of AA was > 22.59° — the highest average value (Fig. 7a).
The critical age of patients with CP, which shows instability, was ≤ 11 years in mathematical models with probability of detecting positive FEAR index in both positionings (Fig. 4d, 6d); critical age in mathematical models with pro-bability of migration percentage > 33 % in both positionings was ≤ 12 years (Fig. 5d, 7d). This confirms the prevailing view that by the age of 12 years, Y cartilage is being closed and hip displacement is quite rare.
Hip instability does not depend on one indicator, it must be considered as a whole, taking into account all the para-meters.
Conclusions
1. Significant, strong, direct correlations of the FEAR index and NSA (R = 0.39), AA (R = 0.51) and SA (R = 0.50) were found in the standard positioning, as well as in positioning according to our own method (R = 0.47, R = 0.67 and R = 0.56, respectively). A reliable, medium-strength, direct correlation (R = 0.32, p = 0.006) was found between the FEAR index and the FT in the standard positioning, and the relationship in positioning according to our own method were unreliable (R = 0.21, p = 0.077). The FEAR index can be of great importance for predicting the development of the hip joint; in children under 5 years of age, it was difficult to determine it according to the authors’ method.
2. Detection of significant correlations of factors (age, level of lesion, DDH in the past medical history) with FEAR index in positioning according to our own method with unreliable connections in standard positioning, improvement of migration percentage confirm the key role of femoral torsion in hip formation. Correction of FT improves significantly the parameters of the hip joint, although all of them should be considered by surgeons.
3. Our research confirms that the most accurate parameter for determining hip instability at present is the migration percentage. A mathematical model for determining hip instability with probability of migration percentage > 33 % in SP based on AA, NSA, FT, age, is proposed (model accuracy is 92.9 %). The critical level of indicators at which instability is detected are AA > 19.44°, FT > 50°, for NSA > 153.1°, age ≤ 11 years.
Acknowledgment. The authors express their gratitude for the fruitful cooperation of a friend, teacher and colleague V. Hoshko (04.08.1949–28.09.2020).
Received 31.01.2022
Revised 10.02.2022
Accepted 15.02.2022
Список литературы
1. Reimers J. The stability of the hip in children. A radiological study of the results of muscle surgery in cerebral palsy. Acta Orthop. Scand. Suppl. 1980. 184. 1-100. doi: 10.3109/ort.1980.51.suppl-184.01.
2. Wyatt M., Weidner J., Pfluger D., Beck M. The Femoro-Epiphyseal Acetabular Roof (FEAR) Index: a new measurement associated with instability in borderline hip dysplasia? Clin. Orthop. Relat. Res. 2017. 475(3). 861-869. doi: 10.1007/s11999-016-5137-0.
3. Upadhyay S.S., Burwell R.G., Moulton A., Small P.G., Wallace W.A. Femoral anteversion in healthy children. Application of a new method using ultrasound. J. Anat. 1990 Apr. 169. 49-61.
4. Palisano R., Rosenbaum P., Walter S., Russell D., Wood E., Galuppi B. Development and reliability of a system to classify gross motor function in children with cerebral palsy. Dev. Med. Child Neurol. 1997 Apr. 39(4). 214-223. doi: 10.1111/j.1469-8749.1997.tb07414.x.
5. Kutsenok Ya.B. Developmental dysplasia of hip. Congenital subluxation and dislocation of the thigh. Kyiv: Zdorovya, 1992. 184 p. [in Ukrainian].
6. Ruwe P.A., Gage J.R., Ozonoff M.B., DeLuca P.A. Clinical determination of femoral anteversion. A comparison with established techniques. J. Bone Joint Surg. Am. 1992 Jul. 74(6). 820-30.
7. Hoshko V.Iu., Naumenko N.O., Cheverda A.I., Yatsuliak M.B., Nemesh M.M., inventors. SI “Institute of Traumatology and Orthopedics of NAMS of Ukraine”, assignee. The method of determining the clinical and radiographic parameters of the hip joint in patients with pathology of the hip joint. Ukrainian patent No. 137567. 2019 Oct 25 [in Ukrainian].
8. Hoshko V.Iu., Naumenko N.O., Yatsuliak M.B., Cheverda A.I., Nemesh M.M., Martsyniak S.M. Substantiation of the method for determining the clinical and radiographic parameters of the hip joint in patients with cerebral palsy. Trauma. 2021. 22(1). 61-65. doi: 10.22141/1608-1706.1.22.2021.226411.
9. Fabeck L., Tolley M., Rooze M., Burny F. Theoretical study of the decrease in the femoral neck anteversion du-ring growth. Cells Tissues Organs. 2002. 171. 269-275. doi: 10.1159/000063127.
10. Yatsulіak M., Nemesh M., Martsyniak S., Kabatsii M., Fi-lipchuk V. Original positioning method to determine the clinical and radiographic parameters of the hip joint in patients with cerebral palsy. MOJ Orthopedics & Rheumatology [Internet]. 2021 Aug 13(4). 90-93. Available from: https://medcraveonline.com/MOJOR/MOJOR-13-00555.pdf. doi: 10.15406/mojor.2021.13.00555.
11. Hoshko V.Iu., Naumenko N.O., Yatsuliak M.B., inventors. SI “Institute of Traumatology and Orthopedics of NAMS of Ukraine”, Hoshko V.Iu., Yatsuliak M.B., assignees. Orthopedic attachment for laying the patient during radiography of the hip joints. Ukrainian patent No. 122629. 2020 Dec 10 [in Ukrainian].
12. Hoshko V.Iu., Naumenko N.O., Yatsuliak M.B., inventors. SI “Institute of Traumatology and Orthopedics of NAMS of Ukraine”, Hoshko V.Iu., Yatsuliak M.B., assignees. Orthopedic attachment for laying the patient during radiography of the hip joints. Ukrainian patent No. 140346. 2020 Feb 25 [in Ukrainian].
13. Yatsuliak M., Nemesh M., Martsyniak S., Kabatsii M., Filipchuk V. Clinical and radiological morphometric dependences during the formation of the acetabulum among patients with cerebral palsy. MOJ Orthop. Rheumatol. 2021. 13(5). 106-109. Available from: https://medcraveonline.com/MOJOR/MOJOR-13-00558.pdf. doi: 10.15406/mojor.2021.13.00558.
14. Miller S., Habib E., Bone J., Schaeffer E., Yang B.W., Shea J., Maleki A., Shore B.J., Mulpuri K. Inter-rater and intrarater reliabilities of the identification of a “gothic arch” in the acetabulum of children with cerebral palsy. J. Pediatr. Orthop. 2021 Jan. 41(1). 6-10. doi: 10.1097/BPO.0000000000001615.

/52.jpg)
/53.jpg)
/53_2.jpg)
/54.jpg)
/55.jpg)
/56.jpg)
/57.jpg)
/58.jpg)