
Международный эндокринологический журнал Том 21, №2, 2025
Вернуться к номеру
Новий метод оцінки мікроциркуляції центральної ділянки сітківки у пацієнтів з різними стадіями діабетичного макулярного набряку при цукровому діабеті 2-го типу
Авторы: Сук С.А. (1), Могілевський С.Ю. (2), Ковтун М.І. (2), Жупан Б.Б. (2)
(1) - Київська міська клінічна офтальмологічна лікарня «Центр мікрохірургії ока», м. Київ, Україна
(2) - Національний університет охорони здоров’я України імені П.Л. Шупика, м. Київ, Україна
Рубрики: Эндокринология
Разделы: Клинические исследования
Версия для печати
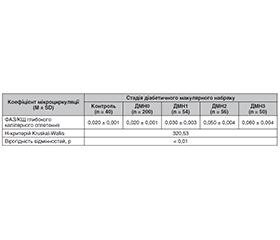
Актуальність. Макулярний набряк може розвинутися на будь-якій стадії діабетичної ретинопатії (ДР), незалежно від її тяжкості. Вважають, що одним із тригерів, відповідальним за накопичення рідини у макулярній зоні, є ішемія як одне з частих і тяжких ускладнень ДР. Оптична когерентна томографічна ангіографія (ОКТА) — це неінвазивна техніка, яка дозволяє візуалізувати шари судинних сплетень сітківки, кількісно оцінювати мікросудинні параметри та корелювати їх з функціональними й морфологічними даними. Дослідження, спрямовані на ідентифікацію ранніх доклінічних біомаркерів мікросудинних аномалій у діабетичній сітківці, є дуже важливими, оскільки раннє лікування асоціюється з кращими результатами. Мета дослідження: провести оцінку мікроциркуляції центральної ділянки сітківки у пацієнтів з різними стадіями діабетичного макулярного набряку (ДМН) при цукровому діабеті 2-го типу (ЦД2) за допомогою оптичної когерентної томографічної ангіографії. Матеріали та методи. Під спостереженням перебували 680 пацієнтів (1296 очей) з української популяції з ЦД2 та непроліферативною ДР. ДМН 0-ї ст. було діагностовано на 720 очах (55,56 %), 1-ї ст. — 194 очах (14,97 %), 2-ї ст. — 196 очах (15,12 %), 3-ї ст. — 186 очах (14,35 %). Із цієї групи 477 пацієнтам (936 очей) проводилося різноманітне лікування ДМН згідно з протоколами лікування для окремої стадії набряку. 203 пацієнтам (360 очей) з ДМН лікування не проводилося через відмову пацієнтів, саме ця група була метою нашого дослідження. Окрім стандартних офтальмологічних досліджень проводили статичну комп’ютерну периметрію, оптичну когерентну томографію (ОКТ), ОКТА. Для обчислення капілярної щільності (КЩ) та площі фовеолярної аваскулярної зони (ФАЗ) застосовувався метод бінаризації. Далі до бінаризованого знімку був застосований алгоритм виділення суміжних за кольором пікселей, після підрахунку сірих пікселей встановлено фовеолярну аваскулярну зону з площею у поверхневому (ПКС) та глибокому капілярному сплетенні (ГКС) макулярної ділянки. Оцінювалося співвідношення отриманих показників ФАЗ/КЩ поверхневого та глибокого капілярного сплетення, що відповідало розробленому коефіцієнту мікроциркуляції у поверхневому та глибокому капілярному сплетенні центральної зони сітківки на різних стадіях ДМН. Результати. При проведенні ОКТ-ангіографії при зверненні на 200 очах з ДМН0 КЩ поверхневого капілярного сплетення в середньому становила 13,07 ± 0,60 мм2, на 54 очах з ДМН1 — 11,48 ± 0,80 мм2, на 56 очах з ДМН2 — 9,06 ± 0,70 мм2, на 50 очах з ДМН3 — 7,45 ± 0,40 мм2. КЩ глибокого сплетення при ДМН0 становила 18,59 ± 0,30 мм2, ДМН1 — 17,37 ± 0,40 мм2, ДМН2 — 15,82 ± 0,50 мм2, ДМН3 — 11,88 ± 1,00 мм2. При дослідженні ФАЗ у ПКС при ДМН0 вона становила 0,45 ± 0,05 мм2, ДМН1 — 0,54 ± 0,04 мм2, ДМН2 — 0,74 ± 0,05 мм2, ДМН3 — 0,81 ± 0,05 мм2. При дослідженні ФАЗ у ГКС при ДМН0 вона становила 0,43 ± 0,03 мм2, ДМН1 — 0,57 ± 0,04 мм2, ДМН2 — 0,70 ± 0,03 мм2, ДМН3 — 0,75 ± 0,06 мм2. У пацієнтів із ЦД2 коефіцієнт мікроциркуляції центральної ділянки сітківки у поверхневому капілярному сплетенні мав вірогідне підвищення на 40 % при ДМН1, вдвічі при ДМН2, втричі при ДМН3 порівняно з групою контролю та пацієнтами із ДМН0 (H = 277,47; р < 0,01). Коефіцієнт мікроциркуляції центральної ділянки сітківки у глибокому капілярному сплетенні мав вірогідне підвищення вдвічі при ДМН1 та втричі при ДМН2 і ДМН3 порівняно з групою контролю та пацієнтами з ДМН0 (H = 320,53; р < 0,01). Висновки. Розроблений нами коефіцієнт мікроциркуляції поверхневого та глибокого капілярного сплетення макули можна розглядати як прогностичний маркер стану мікроциркуляції центральної зони сітківки при діабетичному макулярному набряку у пацієнтів із непроліферативною ДР та ЦД 2-го типу.
Background. Diabetic macular edema (DME) can develop at any stage of diabetic retinopathy, regardless of its severity. One of the triggers believed to be responsible for the accumulation of fluid in the macular area is ischemia as a frequent and severe complication of diabetic retinopathy. Optical coherence tomography angiography is a non-invasive technique that allows for visualization of retinal vascular plexus layers, quantification of microvascular parameters and correlation with functional and morphological data. Research aimed at identifying early preclinical biomarkers of microvascular abnormalities in the diabetic retina is very important, as early treatment is associated with better outcomes. The purpose is to evaluate microcirculation of the central retina in patients with different stages of diabetic macular edema in type 2 diabetes using a new method of optical coherence tomography angiography. Materials and methods. 680 patients (1296 eyes) from the Ukrainian population with type 2 diabetes mellitus and non-proliferative diabetic retinopathy were under observation. DME0 was diagnosed in 720 eyes (55.56 %), DME1 in 194 eyes (14.97 %), DME2 in 196 eyes (15.12 %), DME3 in 186 eyes (14.35 %). From this group, 477 patients (936 eyes) underwent various DME treatment according to protocols for a specific stage of edema. 203 patients (360 eyes) with DME were not treated due to their refusal, this group was the target of our study. In addition to standard ophthalmic examinations, optical coherence tomography, optical coherence tomography angiography, and computer perimetry were performed. The binarization method was used to calculate the capillary density (CD) and the area of the foveal avascular zone (FAZ). Next, an algorithm was applied to the binarized image to select pixels adjacent in color, and after counting the gray pixels, the FAZ with an area in the superficial and deep capillary plexus of the macular area was identified. The ratio of the obtained indicators of the FAZ/CD of the superficial and deep capillary plexuses was evaluated, which corresponded to the developed coefficient of microcirculation in the superficial and deep capillary plexuses of the central retina at different stages of DME. Results. During optical coherence tomography angiography at the time of admission, in 200 eyes with DME0, the average CD of superficial capillary plexus was 13.07 ± 0.60 mm2, in 54 eyes with DME1 — 11.48 ± 0.80 mm2, in 56 eyes with DME2 — 9.06 ± 0.70 mm2, in 50 eyes with DME3 — 7.45 ± 0.40 mm2. The CD of the deep plexus in DME0 was 18.59 ± 0.30 mm2, DME1 — 17.37 ± 0.40 mm2, DME2 — 15.82 ± 0.50 mm2, DME3 — 11.88 ± 1.00 mm2. When studying superficial plexus, the FAZ at DME0 was 0.45 ± 0.05 mm2, DME1 — 0.54 ± 0.04 mm2, DME2 — 0.74 ± 0.05 mm2, DME3 — 0.81 ± 0.05 mm2. During the study of the deep plexus, the FAZ in DME0 was 0.43 ± 0.03 mm2, DME1 — 0.57 ± 0.04 mm2, DME2 — 0.70 ± 0.03 mm2, DME3 — 0.75 ± 0.06 mm2. In patients with type 2 DM, the coefficient of microcirculation in the superficial capillary plexus of the central retina was significantly increased by 40 % in DME1, in DME2 by 2 times, in DME3 by 3 times compared to the control group and patients with DME0 (H = 277.47; p < 0.01). The coefficient of microcirculation in the deep capillary plexus of the central retina had a significant increase of 2 times in DME1 and 3 times in DME2 and DME3 compared to the control group and patients with DME0 (H = 320.53; p < 0.01). Conclusions. The coefficient of microcirculation in the superficial and deep capillary plexuses developed by us can be considered a prognostic marker of the microcirculation state of the central retinal zone in diabetic macular edema in patients with non-proliferative diabetic retinopathy and type 2 diabetes.
діабетичний макулярний набряк; оптична когерентна томографія — ангіографія; коефіцієнт мікроциркуляції макули; цукровий діабет 2-го типу
diabetic macular edema; optical coherence tomography angiography; macular coefficient of microcirculation; type 2 diabetes mellitus
Для ознакомления с полным содержанием статьи необходимо оформить подписку на журнал.
- Miller K, Fortun JA. Diabetic Macular Edema: Current Understanding, Pharmacologic Treatment Options, and Developing Therapies. Asia Pac J Ophthalmol (Phila). 2018 Jan-Feb;7(1):28-35. doi: 10.22608/APO.2017529. PMID: 29473719.
- Browning DJ, Stewart MW, Lee C. Diabetic macular edema: Evidence-based management. Indian J Ophthalmol. 2018 Dec;66(12):1736-1750. doi: 10.4103/ijo.IJO_1240_18. PMID: 30451174; PMCID: PMC6256891.
- Hwang TS, Gao SS, Liu L, Lauer AK, Bailey ST, Flaxel CJ, Wilson DJ, et al. Automated quantification of capillary nonperfusion using optical coherence tomography angiography in diabetic retinopathy. JAMA Ophthalmol. 2016;134:367-373. doi: 10.1001/jamaophthalmol.2015.5658.
- Abdelshafy M, Abdelshafy A. Functional and structural chan–ges of the retinal nerve fiber layer and ganglion cell complex in heavy smo–kers. Clin. Ophthalmol. 2020;14,397-404. doi: 10.2147/OPTH.S235892.
- Gildea D. The diagnostic value of optical coherence tomography angiography in diabetic retinopathy: a systematic review. Int. Ophthalmol. 2019;39:2413-2433. doi: 10.1007/s10792-018-1034-8.
- Scarinci F, Varano M, Parravano M. Retinal sensitivity loss correlates with deep capillary plexus impairment in diabetic macular ischemia. J. Ophthalmol. 2019:7589841. doi: 10.1155/2019/7589841.
- Balaratnasingam C, Inoue M, Ahn S, McCann J, Dhrami-–Gavazi E, Yannuzzi LA, Freund KB. Visual acuity is correlated with the area of the foveal avascular zone in diabetic retinopathy and retinal vein occlusion. Ophthalmol. Times. 2016;123:2352-2367. doi: 10.1016/j.ophtha.2016.07.008.
- Sorour O, Arya M, Waheed N. New findings and challenges in OCT angiography for diabetic retinopathy. Ann. Eye Sci. 2018;3:44. doi: 10.21037/aes.2018.08.03.
- Cheung CMG, Fawzi A, Teo KY, Fukuyama H, Sen S, Tsai WS, Sivaprasad S. Diabetic macular ischaemia — a new therapeutic target? Prog. Retin. Eye Res. 2022;89:101033. doi: 10.1016/j.preteyeres.2021.101033.
- Munk MR, Kashani AH, Tadayoni R, Korobelnik JF, Wolf S, Pichi F, Koh A, et al. Recommendations for OCT angiography reporting in retinal vascular disease: a Delphi approach by international experts. Ophthalmol. Retina. 2022;S2468-6530(22)00066-5. doi: 10.1016/j.oret.2022.02.007.
- Daruich A, Matet A, Moulin A, Kowalczuk L, Nicolas M, Sellam A, Rothschild PR, et al. Mechanisms of macular edema: Beyond the surface. Prog Retin Eye Res. 2018 Mar;63:20-68. doi: 10.1016/j.preteyeres.2017.10.006. Epub 2017 Nov 7. PMID: 29126927.
- Rosen RB, Andrade Romo JS, Krawitz BD, Mo S, Fawzi AA, Linderman RE, Carroll J, et al. Earliest Evidence of Preclinical Dia–betic Retinopathy Revealed Using Optical Coherence Tomography Angiography Perfused Capillary Density. Am J Ophthalmol. 2019 Jul;203:103-115. doi: 10.1016/j.ajo.2019.01.012. Epub 2019 Jan 26. PMID: 30689991; PMCID: PMC6612596.
- Tang FY, Chan EO, Sun Z, Wong R, Lok J, Szeto S, Chan JC, et al. Clinically relevant factors associated with quantitative optical coherence tomography angiography metrics in deep capillary plexus in patients with diabetes. Eye Vis (Lond). 2020 Feb 3;7:7. doi: 10.1186/s40662-019-0173-y. PMID: 32025523; PMCID: PMC6996172.
- Tan GS, Cheung N, Simó R, Cheung GC, Wong TY. Dia–betic macular oedema. The Lancet Diabetes and Endocrinology. 2017;5(2):143-155. doi: 10.1016/S2213-8587(16)30052-3.
- Suk S, Mogilevskyy S. Diagnostic markers of severe diabetic macular edema in patients with type 2 diabetes. International Journal of Endocrinology (Ukraine). 2024;20(8):613-621. https://doi.org/–10.22141/2224-0721.20.8.2024.1469.
- Guo X, Chen Y, Bulloch G, Xiong K, Chen Y, Li Y, Liao H. et al. Parapapillary Choroidal Microvasculature Predicts Diabetic Retinopathy Progression and Diabetic Macular Edema Development: A Three-Year Prospective Study. Am. J. Ophthalmol. 2023;245:164-173. doi: 10.1016/j.ajo.2022.07.008.
- Yan J, Li WJ, Qin YZ, Qiu XY, Qin L, Li JM. Aqueous angiopoietin-like levels correlate with optical coherence tomography angiography metrics in diabetic macular edema. Int. J. Ophthalmol. 2021;14:1888-1894. doi: 10.18240/ijo.2021.12.12.
- Chu Z, Lin J, Gao C, Xin C, Zhang Q, Chen CL, Roisman L. et al. Quantitative assessment of the retinal microvasculature using optical coherence tomography angiography. J. Biomed. Opt. 2016;21:66008. doi: 10.1117/1.JBO.21.6.066008.
- Eldaly Z, Soliman W, Sharaf M, Reyad AN. Morphological characteristics of normal foveal avascular zone by optical cohe–rence tomography angiography. J. Ophthalmol. 2020:8281459. doi: 10.1155/2020/8281459.
- Pramil V, Levine ES, Waheed NK. Macular vessel density in diabetic retinopathy patients: how can we accurately measure and what can it tell us? Clin. Ophthalmol. 2021;15:1517-1527. doi: 10.2147/OPTH.S272328.
- Kim AY, Chu Z, Shahidzadeh A, Wang RK, Puliafit CA, Kashani AH. Quantifying Microvascular Density and Morphology in Diabetic Retinopathy Using Spectral-Domain Optical Coherence Tomography Angiography. Investig. Ophthalmol. Vis. Sci. 2016;57:362-370. doi: 10.1167/iovs.15-18904.
- AttaAllah HR, Mohamed AAM, Ali MA. Macular vessels density in diabetic retinopathy: Quantitative assessment using optical coherence tomography angiography. Int. Ophthalmol. 2019;39:1845-1859. doi: 10.1007/s10792-018-1013-0.
- Lee J, Moon BG, Cho AR, Yoon YH. Optical Coherence Tomography Angiography of DME and Its Association with Anti-VEGF Treatment Response. Ophthalmology. 2016;123:2368-2375. doi: 10.1016/j.ophtha.2016.07.010.